How much marketing budget does a B2B company need?

A B2B company needs as much marketing budget as its growth target demands and its sales team can turn into revenue. Work it out from the new revenue you need, the average deal size, your win rate and the cost per opportunity. Then add people and tools. Gartner's 2026 benchmark of 7.8% of revenue is a cross-check. Never start there.
This guide is for founders, CEOs and marketing leads who have to put one number into next year's plan and defend it. It answers "how much." The role of the person who owns that number is in the guide on what a head of marketing does in a B2B company. The line-by-line process is in the companion guide on how to plan a marketing budget step by step.
My take in one line: a marketing budget is a purchase order for pipeline. If you can't say how much pipeline the money buys, the number is a guess. It doesn't matter which percentage it happens to match.
How much do B2B companies spend on marketing?
Large companies spend about 7.8% of revenue on marketing, according to Gartner's 2026 CMO Spend Survey of 401 marketing leaders in North America, the UK and Europe. Most of them work at companies with more than $1 billion in annual revenue. For a B2B company with 50 or 500 employees, that figure is context. Don't treat it as a target.
Gartner reported 7.7% for both 2025 and 2024. In the 2025 survey, paid media was the largest single block at 30.6% of the marketing budget. And in 2026, 56% of CMOs said their marketing organization lacked the budget to deliver its strategy. So even companies at 7.8% feel short.
| Benchmark | Value | What it tells you | What it doesn't |
|---|---|---|---|
| Budget as share of revenue (Gartner 2026) | 7.8% | What large companies spend on average | What a company of your size and growth plan needs |
| Paid media as share of budget (Gartner 2025) | 30.6% | How large budgets split between media and everything else | Whether paid media is your best channel |
| Budget of AI-ready organizations (Gartner 2026) | 8.9% | That teams with mature AI capability spend more | That spending more causes better results |
| CMOs short of budget (Gartner 2026) | 56% | That budget pressure is normal, even at 7.8% | How much would be enough |
Why is percent of revenue the wrong starting point?
Percent of revenue ties next year's marketing budget to last year's sales. That's backwards for a company that wants to grow. Two firms with the same revenue can need very different budgets. One defends a stable customer base. The other has to double new business in a market where nobody knows its name yet.
The rule fails in three predictable ways:
- Growth is missing. A company planning 30% growth and one planning 5% get the same budget if their revenue is the same.
- Deal size is missing. Selling CHF 5,000 subscriptions takes far more opportunities than selling CHF 500,000 machines. And opportunities are what marketing money buys.
- Sales capacity is missing. A budget that creates more opportunities than sales can work burns money. One that creates fewer leaves account executives prospecting when they should be selling.
Percent of revenue still has one job: a sanity check once the math is done. If your calculation lands at 2% of revenue or at 25%, go back to your assumptions before you defend the number.
What decides how much marketing budget a B2B company needs?
Five things set the size of a B2B marketing budget. How much new revenue you need, what one deal is worth, how many qualified opportunities you win, how many opportunities your sales team can handle, and the fixed base of people, tools and website that exists before the first campaign runs. Benchmarks come in only after these five.
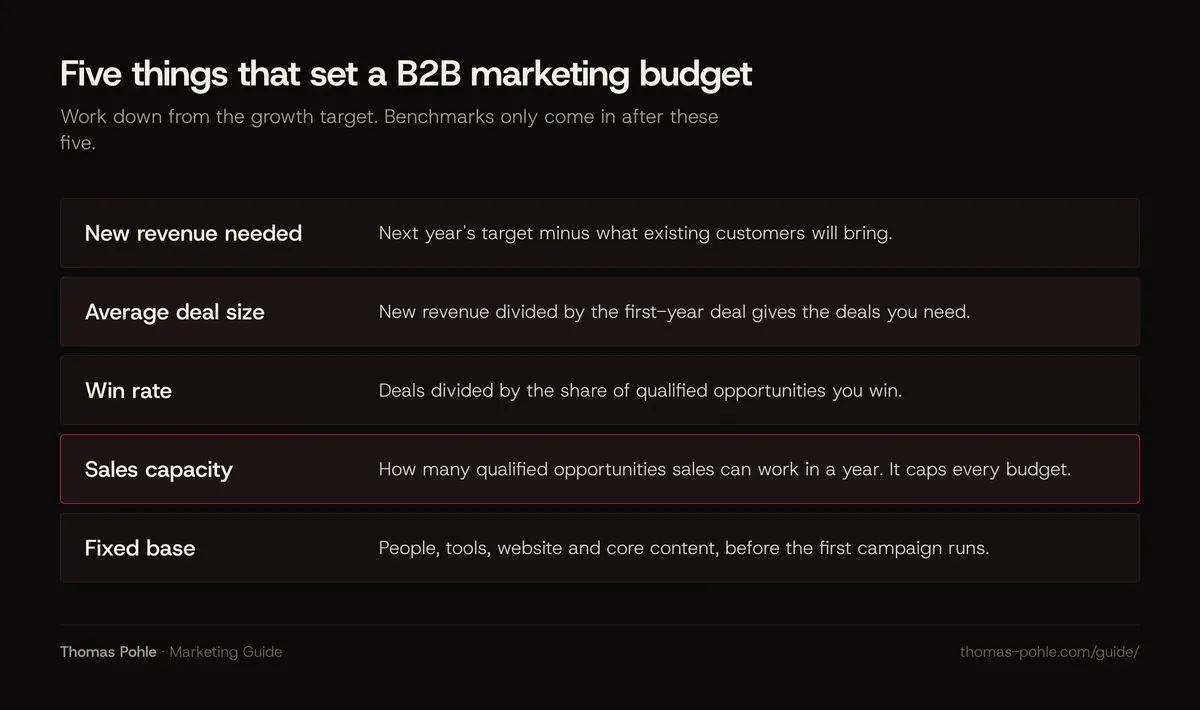
- New revenue needed. Next year's target minus what existing customers will bring. That gap is the job of marketing and sales.
- Average deal size. New revenue divided by the average first-year deal gives you the number of deals you need.
- Win rate. Deals divided by the share of qualified opportunities you win gives you the opportunities you need.
- Sales capacity. How many qualified opportunities your sales team can actually work in a year. This is the sales reality that caps every budget.
- Fixed base. Marketing people, tools, website and core content. They exist whatever the campaign plan says.
A sixth factor kicks in when you want to take market share: share of voice, your share of all advertising in the category. Les Binet and Peter Field found, in their 2019 analysis for LinkedIn's B2B Institute, that for B2B businesses "10% Extra Share of Voice (ESOV) grows market share by 0.7%." My take: that formula works best for established companies in a well-defined category. A young company rarely knows its share of voice.
How do you calculate a marketing budget from your growth target?
Start with the new revenue you need. Divide it by the average deal size to get deals. Divide the deals by your win rate to get qualified opportunities. Take the share marketing is expected to source and multiply by your cost per opportunity. Then add the fixed base. You end up with a number you can explain line by line. That's what a leadership team wants.
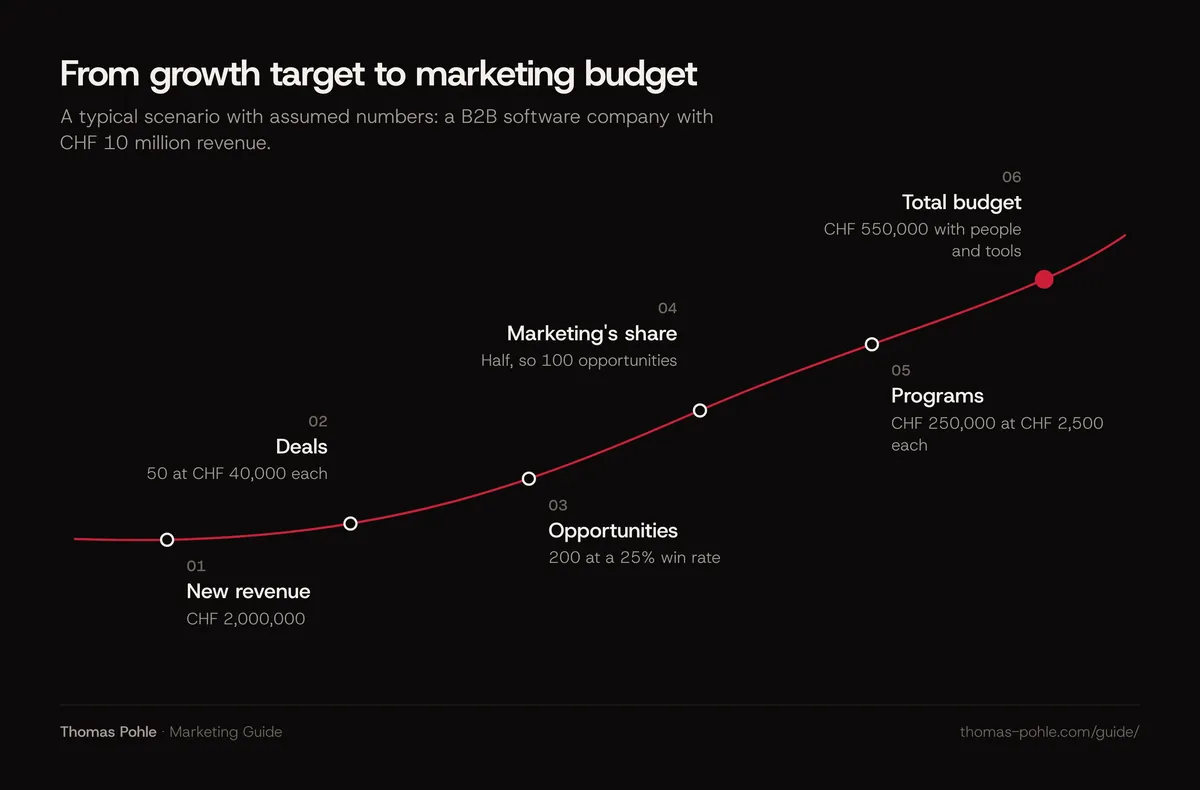
Here's a typical scenario with assumed numbers. Replace them with your own. A Swiss B2B software company has CHF 10 million in revenue and wants CHF 2 million of new revenue next year.
- New revenue. CHF 2,000,000.
- Deals. At an average first-year deal of CHF 40,000, that's 50 new deals.
- Opportunities. At a 25% win rate on qualified opportunities, sales needs 200 of them.
- Marketing's share. Marketing is expected to source half, so 100 opportunities.
- Programs. At CHF 2,500 per qualified opportunity, campaigns cost CHF 250,000.
- Fixed base. Two marketing people at CHF 130,000 each, fully loaded, plus CHF 40,000 for tools and website: CHF 300,000.
- Total. CHF 550,000, or 5.5% of revenue.
Now check the result against sales reality. Assume three account executives who can each work 60 qualified opportunities a year. That's a capacity of 180, against 200 needed. The sales plan is short. So the company hires, raises the win rate or lowers the target. More marketing money can't close a capacity gap in sales.
Cost per opportunity comes from last year's CRM: marketing spend per channel divided by the qualified opportunities that channel produced. No history? Test one channel for a quarter first. The guide to measuring marketing success in B2B shows how to count opportunities without heavy tracking.
At smino, where I was Head of Marketing, marketing and sales ran as one team. Here's my view: that's the precondition. If the two teams define an opportunity differently, the calculation breaks at step three.
How much budget do you need in different situations?
The growth math gives you the number for a normal year. Some situations change the logic: a founder-led start, growth in a known market, entry into a new country, a product launch or a year of holding position. The table shows how I'd approach each one. The thresholds are my rules of thumb. They aren't research findings.
| Situation | Budget logic | Fund first |
|---|---|---|
| Founder sells, revenue under about CHF 2 million | Fixed base plus one channel with a test budget | Positioning, website, the founder's LinkedIn presence |
| Growing in a known market | Growth math with last year's cost per opportunity | The two channels with the lowest cost per opportunity |
| Entering a new market or country | Growth math plus a launch budget for two quarters without pipeline history | Local proof, one event or partner, market research |
| Launching a new product | A separate line, judged on its own pipeline | Sales material and launch content |
| Holding position | Fixed base plus enough presence to keep share of voice level with share of market | Customer marketing and brand |
The last row rests on Binet and Field's finding, as LinkedIn's B2B Institute summarizes it: brands that set share of voice above share of market tend to grow. My reading: holding position means keeping the two roughly level. It never means cutting brand to zero.
A new market gets its own line because the growth math has no inputs there yet. Budget two quarters as a launch, then switch to the math. The guide on building a B2B marketing strategy covers how to choose markets.
What is the minimum marketing budget that still works?
The minimum budget is the fixed base plus one channel, funded heavily enough to produce a measurable result within a quarter. Go below that and money spread across five channels buys you five inconclusive tests. My take: one channel done properly beats five channels done a little, at any budget size.
Ad platforms only set technical floors. LinkedIn's minimum daily budget is $10 for any ad format, and a new campaign needs a lifetime budget of at least $100. Google Ads may spend up to twice your average daily budget on a given day, but no more than 30.4 times the daily budget in a month. Those numbers tell you how little you can spend. They don't tell you what it takes to reach enough buyers in your segment.
My rule of thumb for a useful floor: enough to produce at least ten qualified opportunities on the tested channel in one quarter. Only then does the cost per opportunity you measure mean something. At an assumed CHF 2,500 per opportunity, that's CHF 25,000 for the quarter. Out of reach? Put the money into the fixed base and into earned channels first: customer stories, founder posts and partner events. The guide on how B2B companies generate qualified leads shows where to start.
How do you know if your marketing budget is too low or too high?
Your marketing budget is too low when sales has capacity but no pipeline. It's too high when opportunities pile up that nobody works, or when cost per opportunity keeps rising while volume stays flat. Check both signals every quarter. They tell you more about your budget than any benchmark comparison.
- Too low. Account executives prospect instead of selling, pipeline coverage falls below what your win rate needs, and channels that work hit a budget cap before they saturate.
- Too high. New opportunities wait days for a first call, extra money in a channel brings fewer opportunities than the money before it, and spend gets pushed out in December to use it up.
- About right. Cost per opportunity per channel is stable or falling, sales follows up within a day or two, and you can name the line item you'd cut first.
Pipeline coverage is open qualified pipeline divided by the revenue target for the same period. With a 25% win rate you need about four times the target in pipeline. That's plain arithmetic. No benchmark needed.
"Sales is short on pipeline" is one of the three situations in which companies call me. In my experience, the cause is more often where the money goes than how much there is.
What to do this week
You can get to a first budget number in an afternoon, with data you already have in the CRM and in finance. These seven steps give you a figure you can explain line by line. And defend, when someone asks where it comes from.
- Write down next year's revenue target and what existing customers will bring. The gap is your new revenue.
- Pull the average first-year deal size and the win rate on qualified opportunities from the CRM for the last 12 months.
- Calculate the opportunities you need. Agree with sales which share marketing sources.
- Work out cost per qualified opportunity per channel from last year's spend.
- Ask sales how many qualified opportunities each account executive can work in a year. Compare that with what you need.
- Add the fixed base: people, tools, website.
- Divide the total by revenue and compare it with Gartner's 2026 average of 7.8%. If it's far off, recheck the assumptions. Keep the method.
The guide on planning a marketing budget step by step shows how to turn it into line items, phase it over the year and defend it in the leadership meeting.
Want a second pair of eyes on the math before it goes to the board? A one-day Momentum Workshop is one way to get there.
Frequently asked questions
What percentage of revenue should a B2B company spend on marketing?
There's no correct percentage. Gartner's 2026 CMO Spend Survey puts the average at 7.8% of revenue, but its sample consists mostly of companies with more than $1 billion in revenue. Calculate your budget from your growth target, deal size, win rate and cost per opportunity. Then use the percentage as a cross-check. A result far from the benchmark is your cue to check your assumptions.
Does the marketing budget include salaries?
It should, at least in the version leadership sees. People are usually the largest fixed cost and the main trade-off against agencies and media. Gartner's surveys treat labor as one of the main blocks of marketing spend, next to paid media, martech and agencies. If salaries sit in an HR budget, show them anyway. Otherwise nobody sees the full cost of marketing.
How much marketing budget does a startup need?
A founder-led startup needs focus more than money: a clear position, a website that converts and one channel tested properly. My take: the first budget should cover the fixed base and a quarter-long test of one channel, sized to produce about ten qualified opportunities. Scale the channel that works. Only then add the next one.
What is a good cost per opportunity in B2B?
There's no reliable public benchmark that fits every market, deal size and channel. Most figures in circulation are vendor estimates. Your own CRM history is the better source. A higher cost per opportunity is fine for larger deals. What matters is the ratio to the expected revenue per opportunity, which is the average deal size multiplied by the win rate.
Sources
- Gartner: 2026 CMO Spend Survey finds CMOs allocate 15.3% of marketing budgets to AI (May 2026)
- Gartner: 2025 CMO Spend Survey reveals marketing budgets have flatlined at 7.7% of overall company revenue (May 2025)
- LinkedIn: How B2B marketing really drives growth (Binet and Field, October 2019)
- LinkedIn B2B Institute: Marketing as growth (Les Binet and Peter Field)
- LinkedIn Marketing Solutions: Making the most of your budget
- Google Ads Help: About overdelivery and your average daily budget

Thomas PohleB2B marketing advisor in Zurich. More than ten years in B2B marketing at Link11, Beekeeper and smino, most recently as Head of Marketing. CEO and co-founder of TEISENDA. Researched and drafted with AI tools, checked against the sources listed above. More about Thomas