How do you measure marketing success in a B2B company?

You measure B2B marketing success by working backward from revenue. Start with the new revenue you need. Translate it into won deals, opportunities and qualified conversations, and track the handful of numbers that predict them. Leadership sees four to six of those numbers once a month. The team watches channel metrics weekly. Long sales cycles and brand effects need time, so judge marketing over quarters. Single campaigns tell you little.
This is for founders, CEOs and heads of marketing in B2B companies who get a monthly report full of clicks and leads and still can't say whether marketing pays. You get the revenue chain, a worked example with numbers, the split between leadership and team metrics, an honest look at attribution, and a routine you can start this week.
What does marketing success mean in a B2B company?
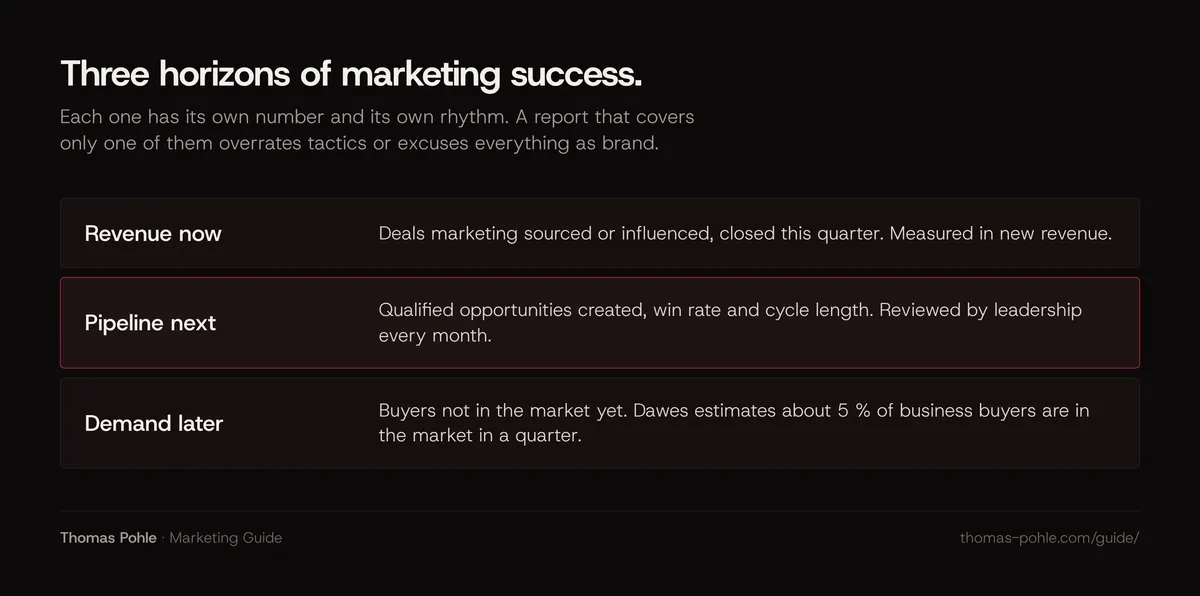
Marketing success in B2B means a measurable contribution to revenue, now and later. That covers three horizons: revenue closed this quarter, pipeline that will close in the next quarters, and demand among buyers who aren't looking yet. A report that covers only one of the three either overrates short-term tactics or excuses everything as brand.
Most reports ignore the third horizon. It's the largest. Professor John Dawes of the Ehrenberg-Bass Institute, writing for LinkedIn's B2B Institute, estimates that companies change providers such as their main bank or law firm about once every five years. So only about 20 % of business buyers are in the market over a year, and something like 5 % in a quarter. He calls the 95 % figure a heuristic. It isn't a precise rule. The point holds anyway: most of the people your marketing reaches this month will buy later, if at all.
So success has three parts, each with its own measure:
- Revenue now. New revenue from deals that marketing sourced or influenced, closed this quarter.
- Pipeline next. The value and number of qualified opportunities created, plus the win rate and cycle length.
- Demand later. Whether the buyers who aren't in the market yet know you and think of you when the need comes up.
How do you build marketing measurement backward from revenue?
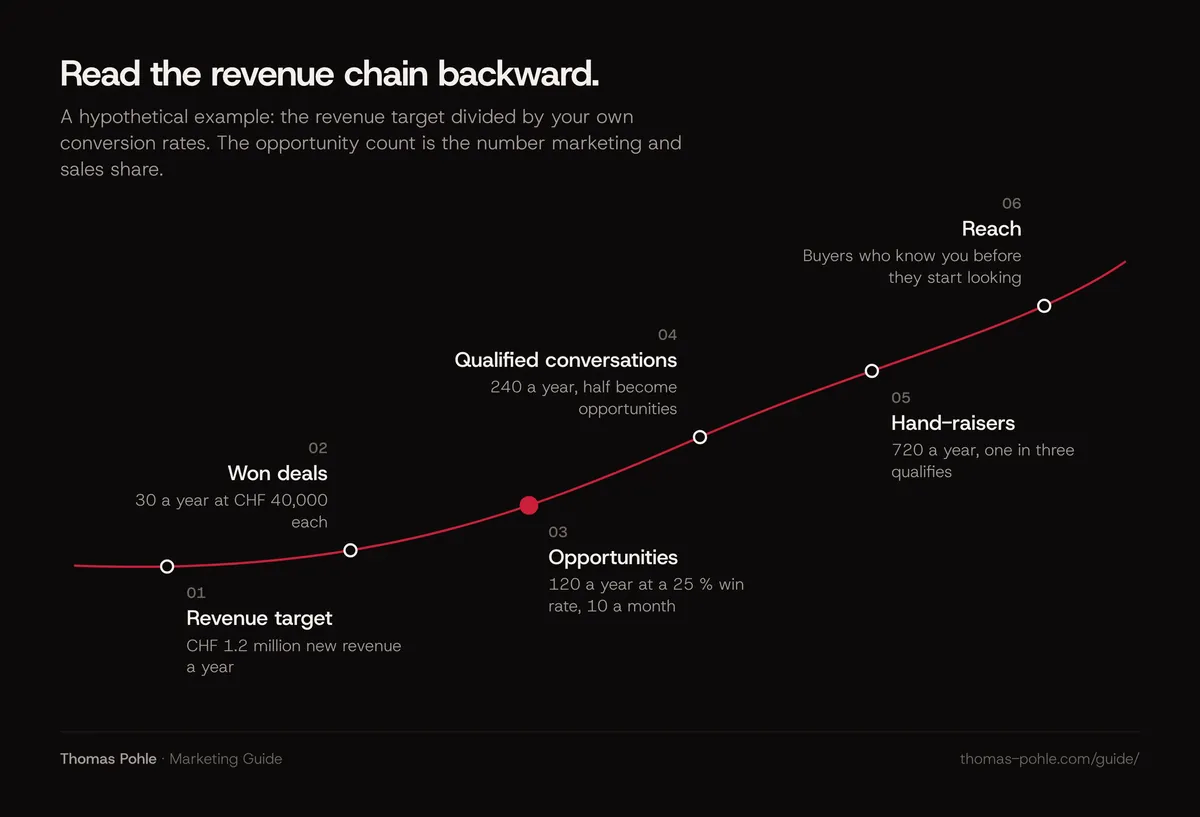
Building measurement backward means you start with the revenue target and divide it through your own conversion rates until you reach the activity marketing controls. You get a short chain: revenue, won deals, opportunities, qualified conversations, hand-raisers, reach. Every link has one number and one owner. Every channel metric has to explain which link it moves.
Here's a typical scenario, with round numbers so the logic stays visible. These aren't benchmarks. Use your own CRM history.
| Link in the chain | Assumption | Result per year | Per month |
|---|---|---|---|
| New revenue target | Set by leadership | CHF 1.2 million | CHF 100,000 |
| Won deals | Average deal CHF 40,000 | 30 deals | 2.5 deals |
| Qualified opportunities | Win rate 25 % | 120 opportunities | 10 |
| Qualified conversations | Half become opportunities | 240 conversations | 20 |
| Hand-raisers | One in three qualifies | 720 hand-raisers | 60 |
Three things fall out of this exercise. First, the monthly number that matters is 10 qualified opportunities. Forget the 60 leads. Second, you see where the biggest lever sits: raising the win rate from 25 % to 30 % cuts the need to 100 opportunities a year. That's cheaper than finding 20 more. Third, you can check whether the target is realistic at all. If you've only ever created four opportunities a month, a plan that needs ten has a budget problem. Better reporting won't fix it.
Two definitions decide whether the chain holds. Write down what counts as a qualified conversation and what counts as an opportunity. Then don't change them during the year. HubSpot's default lifecycle stages are a usable starting point: a marketing qualified lead is one marketing has qualified as ready for sales, a sales qualified lead is one sales has accepted as a potential customer, and an opportunity is a contact associated with a deal.
Which marketing numbers belong in the leadership meeting?
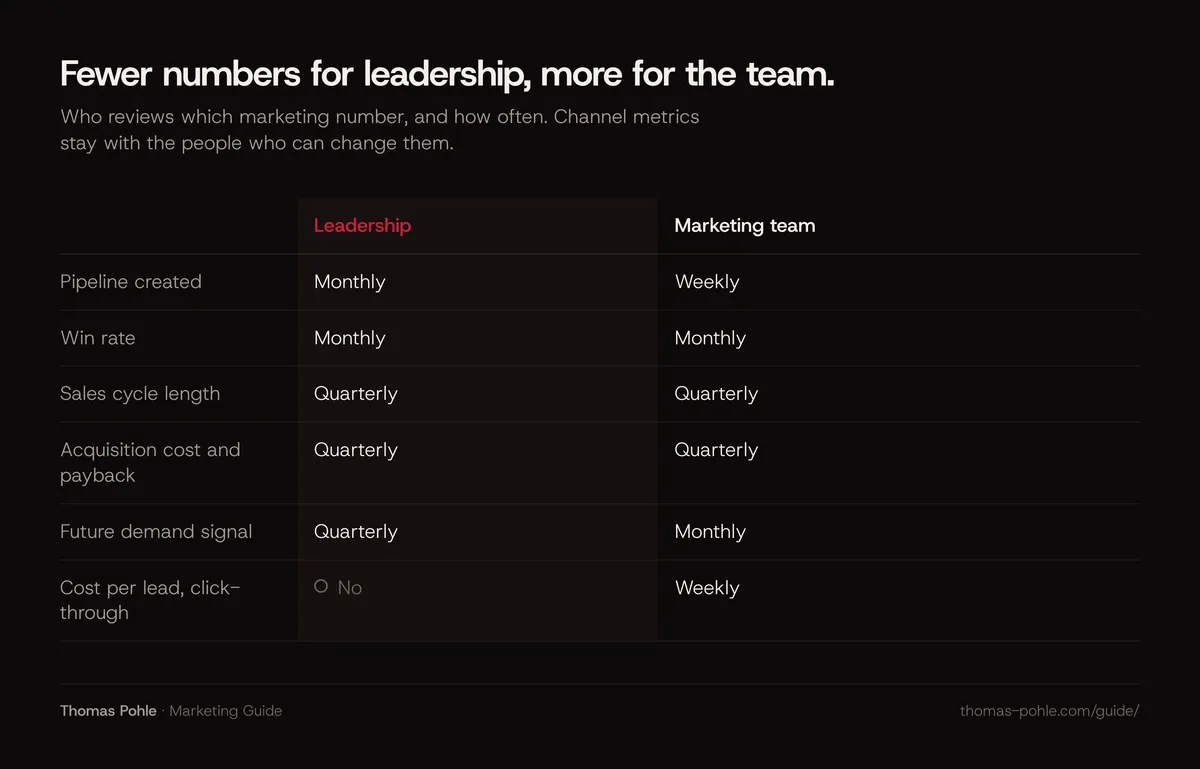
The leadership meeting needs four to six numbers that connect to revenue and change slowly enough to discuss once a month: pipeline created, qualified opportunities, win rate, sales cycle length, customer acquisition cost with payback, and one signal for future demand. Everything else, from click-through rates to followers, belongs in the team's weekly view. That's where people can act on it.
My take: marketing should sit much closer to revenue than it usually does, and the leadership view is where that starts. One number I like there is marketing's share of the pipeline, the part of new pipeline that marketing sourced. In a previous in-house role I raised it from under 10 % to over 50 % within two years. A board that discusses cost per click is doing the team's job and skipping its own.
| Number | How to calculate it | Who sees it |
|---|---|---|
| Pipeline created | Value of new qualified opportunities in the period | Leadership, monthly |
| Win rate | Won deals divided by closed deals (won plus lost) | Leadership, monthly |
| Sales cycle | Average days from opportunity to closed won | Leadership, quarterly |
| Acquisition cost and payback | Sales and marketing cost divided by new customers; months of gross margin to earn it back | Leadership, quarterly |
| Future demand signal | Branded search, self-reported source, or brand survey | Leadership, quarterly |
| Cost per lead, click-through, open rate | Per channel, per campaign | Team, weekly |
One warning about lead counts. Marketing qualified leads are useful inside the team, because they show whether a channel produces interest. As a leadership target they invite gaming. Lower the bar and the number rises while pipeline stays flat. If you report leads upward at all, report them next to the opportunities they became.
Why does attribution rarely tell the full story in B2B?
Attribution assigns credit for a deal to the touchpoints a tool could record. In B2B most of the buying happens where no tool records it: in internal meetings, peer conversations, analyst reports and AI assistants. Long cycles also outlast the data windows of analytics and ad platforms. Use attribution to compare channels. Never treat it as the final answer on what marketing is worth.
The research on buyer behavior explains why. In its 2024 Buyer Experience Report, the vendor 6sense says buyers are nearly 70 % through their purchasing process before they engage sellers, that 81 % already have a preferred vendor at first contact, that the average B2B buying cycle lasts 11.3 months and that the average buying group has 11 people. 6sense doesn't state its sample size in the release, so treat the numbers as directional. They still match what you see in a CRM: the first recorded touch is rarely the first real one.
The tools add their own limits:
- Google Analytics 4. Since November 2023 the attribution reports offer data-driven attribution and two last-click models. First click, linear, time decay and position-based are gone, according to Google's help page.
- Data retention. A standard GA4 property keeps user-level data for 2 or 14 months, which limits explorations and funnel reports. An 11-month cycle barely fits.
- Google Ads offline conversions. Google keeps the click ID (GCLID) for 90 days, and conversions uploaded later aren't imported. If your deals close after six months, import an earlier stage, such as the qualified opportunity, as the conversion.
Two cheap additions fill part of the gap. Ask every inbound contact one open question, "How did you hear about us?", and store the answer in the CRM. And review won deals with sales once a quarter: which content, events or people did the buyer mention? Neither is precise. Both catch what the tools miss, such as a podcast, a recommendation or an AI assistant's shortlist.
How do you measure brand and demand that has not converted yet?
Demand that hasn't converted yet shows up as memory and search behavior long before it shows up in the CRM. Measure it with a small brand survey once or twice a year, the trend in branded search, direct traffic and self-reported sources, and your share of voice compared with your market share. Expect movement over quarters and years. Weeks are too short.
The research is clear on the time frame. Dawes describes measuring mental availability through the links buyers make between your brand and category entry points, the situations in which someone would buy your category. He writes that many well-established brands reach no more than 20 to 30 % of respondents linking them to such a situation, that even market leaders often reach only 50 %, and that getting to double digits is a multi-year task.
Les Binet and Peter Field reach a similar conclusion from the IPA Databank in their report for the B2B Institute. Long-term effects start to dominate short-term ones after about six months. Yet according to a LinkedIn survey cited in the report, only 4 % of B2B marketers measure impact beyond six months. They also found that B2B brands whose share of voice exceeds their market share tend to grow, at about 0.7 percentage points of market share per year for every 10 points of extra share of voice. The authors stress that these B2B results are tentative and based on a small sample.
Practical proxies for a mid-sized company:
- Branded search. Impressions for your company and product names in Google Search Console, as a monthly trend. The guide on measuring organic and AI search visibility shows how to set it up without heavy tracking.
- Self-reported source. The share of inbound contacts who name a channel you can't track, such as LinkedIn posts, a podcast or a colleague.
- Brand survey. A short survey of people from your target group: which providers come to mind for three or four buying situations? Repeat it once a year with the same questions and the same kind of sample.
- AI assistants. Whether ChatGPT, Perplexity or Google's AI features name you for your core questions. The guide on answer engine optimization explains what influences that.
Which tools does a mid-sized B2B company need for measurement?
A mid-sized B2B company needs four things for sound measurement: a CRM with clear lifecycle stages and a source field, a lean web analytics setup, Google Search Console and Bing Webmaster Tools, and reporting from the ad platforms you actually use, connected to the CRM. One spreadsheet or dashboard brings the leadership numbers together. More tools rarely produce more truth.
- CRM first. Pipeline, win rate and cycle length come from the CRM, so keep its stages and the source field clean. If sales doesn't log opportunities, no marketing tool can fix that. In one company I moved the CRM from Pipedrive to HubSpot for exactly this reason: to get full-funnel targets and forecast reporting we could trust.
- Web analytics, lean. You need visits, sources and form submissions per page. Whether your tracking setup needs consent is a legal question. Clarify it with your data protection advisor before you add tools.
- Search consoles. Free, and the only source for impressions in Google and Bing, including parts of their AI features.
- Ad platforms. Feed qualified opportunities back as conversions, so the platforms optimize for pipeline instead of form fills.
AI can take over much of the routine work here, from pulling numbers into the monthly sheet to summarizing won-deal notes. The guide to AI in B2B marketing covers where to start and what needs a human check.
How do you set up a measurement routine that lasts?
A measurement routine lasts when it's small, fixed in the calendar and owned by one person. A weekly team look at channel metrics. A monthly leadership page with the same four to six numbers. A quarterly review that compares pipeline with plan and decides what to stop. The definitions behind the numbers stay the same all year.
- Weekly, 30 minutes, team. Channel numbers, what ran, what changes next week.
- Monthly, one page, leadership. Pipeline created, opportunities, win rate, with last month and the plan next to each number, plus two sentences of interpretation.
- Quarterly, two hours, leadership and sales. Cycle length, acquisition cost and payback, the demand signal, the won-deal review, and one decision on budget or channels.
- Yearly. Brand survey, new targets, and a check of the definitions.
The monthly page is where it usually goes wrong. Keep the same layout every month, so a change in a number means a change in the business. A redesigned report every quarter hides trends.
Which measurement mistakes should B2B companies avoid?
The most expensive measurement mistakes in B2B: judging a channel after four weeks, reporting leads instead of pipeline, crediting everything to the last click, changing definitions mid-year and measuring without a baseline. Each one makes marketing look better or worse than it is. Both lead to wrong budget decisions.
- Too short a window. With cycles near a year and most buyers out of the market, a four-week campaign verdict mostly measures noise.
- Leads as the goal. Lead targets reward volume and ignore fit. Tie every lead number to the opportunities it produced.
- Last click as the truth. It credits the brand search at the end and ignores what made the buyer search.
- Moving definitions. A new opportunity definition in June breaks the year-over-year comparison.
- No baseline. Write down this month's numbers before you start anything new. Otherwise you'll never know what changed.
- Invented precision. A clean estimate labeled as an estimate beats a precise-looking figure nobody can trace.
Measurement is also the test of a strategy. If you can't say which link of the revenue chain a planned activity should move, the activity probably isn't part of your B2B marketing strategy.
What to do this week
- Write down your new revenue target for the next 12 months and your average deal size.
- Pull last year's win rate and opportunity count from the CRM. Then calculate the monthly opportunity number you need.
- Define in one sentence each what a qualified conversation and an opportunity are. Share it with sales.
- Add a "How did you hear about us?" field to your contact form and the CRM.
- Draft the one-page leadership view with four to six numbers and put the first review in the calendar.
- Check whether your ad platforms can receive the qualified opportunity as a conversion within their time limits.
- Note this month's branded search impressions in Search Console as your baseline.
None of this needs a new tool. It needs agreed definitions and a fixed date. Once the chain is written down, budget discussions get shorter, because everyone argues about the same numbers.
Want to set up the revenue chain and the leadership view together with your team? That's a typical topic for a one-day Momentum Workshop.
Frequently asked questions
What is the most important marketing KPI in B2B?
My take: if you can track only one number, track pipeline created, the value of new qualified opportunities in a period. It connects marketing to revenue, moves faster than closed deals and is hard to inflate without sales noticing. Pair it with win rate. Pipeline that never closes isn't success.
How long does it take to see the results of B2B marketing?
Activation, such as search ads to people who are already looking, can show results within weeks. Brand building takes longer. Binet and Field report that long-term effects start to dominate after about six months, and Dawes describes building mental availability as a multi-year task. Judge activity over at least two quarters.
Should marketing be measured on marketing qualified leads?
Inside the team, yes, as an early signal of whether a channel creates interest. As a leadership target, no. Lead targets reward volume and invite lowering the bar. Report leads only next to the opportunities and pipeline they turned into, with fixed definitions that sales has agreed to.
Which attribution model should a B2B company use?
Google Analytics 4 now offers only data-driven attribution and last-click models. Use the data-driven model to compare digital channels. Don't treat any model as the final answer. Add a self-reported source field and a quarterly won-deal review with sales to capture the touchpoints tools can't see.
How do you measure marketing ROI with long sales cycles?
Measure on an earlier stage that predicts revenue, such as qualified opportunities, and convert it with your historical win rate and deal size. Calculate acquisition cost and payback quarterly over a rolling twelve months. Import the opportunity stage into ad platforms, because Google Ads keeps click IDs for only 90 days.
Sources
- John Dawes, Ehrenberg-Bass Institute for LinkedIn B2B Institute: Advertising effectiveness and the 95-5 rule
- Les Binet and Peter Field for LinkedIn B2B Institute: The 5 Principles of Growth in B2B Marketing
- 6sense: 2024 Buyer Experience Report press release
- Google Analytics Help: Get started with attribution
- Google Analytics Help: Data retention
- Google Ads Help: Offline conversion imports FAQs
- HubSpot Knowledge Base: Use lifecycle stages
- Google Ads Help: Guidelines for importing offline conversions
- Google Search Central: AI features and your website

Thomas PohleB2B marketing advisor in Zurich. More than ten years in B2B marketing at Link11, Beekeeper and smino, most recently as Head of Marketing. CEO and co-founder of TEISENDA. Researched and drafted with AI tools, checked against the sources listed above. More about Thomas