What should a marketing budget template include?

A B2B marketing budget template needs four tabs: inputs, plan, actuals and review. Each line carries a block (fixed, program or reserve), an owner, quarterly amounts, the qualified opportunities it should deliver and its cost per opportunity. Actuals sit next to the plan, and a quarterly review records what moved and why.
Most free templates are built for consumer brands: rows for TV, print and influencers, one column per month and nothing that links spend to pipeline. A B2B team needs a sheet that shows what each line buys in opportunities and that survives a quarterly review. This guide gives you that sheet: the tabs, the line items, the columns, a filled example and the formulas.
The template is the working file for two other guides. The size of the budget comes from the guide on how much marketing budget a B2B company needs. The seven planning steps and the review rules are in the guide on planning a marketing budget step by step. Who owns the file is covered in the guide on what a head of marketing does.
What makes a B2B marketing budget template different?
A B2B marketing budget template ties every line of spend to the qualified opportunities it should produce, separates fixed costs from program money and a reserve, and keeps plan and actuals side by side by quarter. A generic template lists expenses. A B2B template answers what the money bought and what moves next quarter.
Three things are missing from most downloadable templates:
- The pipeline link. Without a column for planned opportunities, nobody can see cost per opportunity, and every cut becomes a political discussion.
- The three blocks. Fixed base, program budget and reserve behave differently. Mixing them hides the money you can actually move.
- The review. A budget that's only planned once a year drifts. The template needs a place where quarterly decisions are written down.
Which tabs does the template need?
Four tabs are enough. Inputs holds the numbers from finance and the CRM. Plan holds every budget line by quarter. Actuals holds what was spent and what each line produced. Review holds the quarterly decisions. Everything else, like charts or a board summary, is calculated from these four.
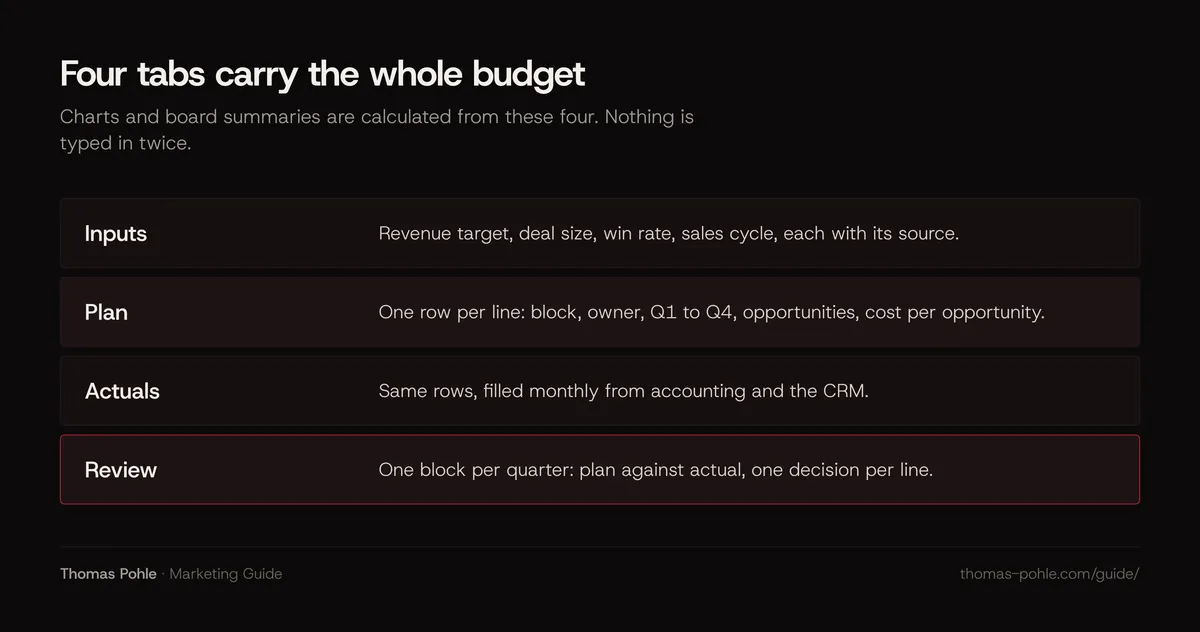
- Inputs. Revenue target, revenue from existing customers, average first-year deal size, win rate, sales cycle, marketing's share of opportunities. Each input has a source cell next to it: the CRM report or the finance file it came from.
- Plan. One row per budget line, columns as in the table below.
- Actuals. Same rows, filled monthly from accounting and the CRM.
- Review. One block per quarter: plan versus actual per line, the decision and who made it.
The source column is my rule. A number in a budget file without a source is a guess, and it gets challenged in the first meeting. I don't publish a number I can't trace, and a budget file shouldn't carry one either.
Which line items belong in a B2B marketing budget?
A B2B marketing budget has line items in three blocks. The fixed base covers people, tools and the website. The program budget covers paid media per channel, content, events, PR and brand. The reserve is one line. Each block is subtotaled, so leadership sees at a glance what's committed and what can move.
The line items I'd start with:
- Fixed base. Salaries and social costs, freelancers on retainer, training, CRM and marketing automation, analytics, design and AI tools, website hosting and development.
- Program budget. Paid search, LinkedIn ads, other paid media, content production, events and trade fairs (stand, travel, follow-up), webinars, PR, brand campaigns, sales material.
- Reserve. One line, about 10% of the program budget, as in the planning guide.
Paid media deserves one row per platform. Gartner's 2025 CMO Spend Survey found paid media to be the largest block of large companies' budgets at 30.6%, with martech at 22.4%, labor at 21.9% and agencies at 20.7%. Use those four categories as a cross-check when you sort lines. Gartner's 2026 survey adds that CMOs now spend 15.3% of the budget on AI. I'd book that where the money goes: licenses under tools, services under agencies.
Which columns does each budget line need?
Each budget line needs columns for its block, its owner, the four quarters, the annual total, the qualified opportunities it should deliver and its planned cost per opportunity. Actuals and variance live in a second set of columns or on the actuals tab. A source or assumption column closes the row.
| Column | What goes in | Example | Why it's there |
|---|---|---|---|
| Line and block | Name and fixed, program or reserve | LinkedIn ads · program | Subtotals per block |
| Owner | One named person | Head of marketing | Someone answers for the line |
| Q1 to Q4 and total | Planned spend per quarter | 30,000 · 30,000 · 15,000 · 15,000 | Phasing by the sales cycle |
| Planned opportunities | Qualified opportunities the line should create | 30 | The link to pipeline |
| Cost per opportunity | Total divided by opportunities | 3,000 | Comparing lines |
| Actual and variance | Spend to date, difference in amount and percent | +8% | Monthly control |
| Source or assumption | Where the number comes from | CRM report, last 12 months | Trust in the meeting |
Fixed lines like salaries get no planned opportunities. Leave the cell empty instead of inventing a number. Their job is to carry the work the program lines rely on.
What does a filled-in marketing budget template look like?
The filled example uses the scenario from the planning guide: a German B2B software company with EUR 20 million in revenue, a budget of EUR 1,050,000 and 128 qualified opportunities planned from marketing. The quarters follow a six-month sales cycle, so demand programs are heavier in the first half. All numbers are assumptions.
| Line (block) | Owner | Total (EUR) | Q1 · Q2 · Q3 · Q4 |
|---|---|---|---|
| People (fixed) | CEO | 330,000 | 82,500 each quarter |
| Tools and website (fixed) | Marketing ops | 60,000 | 30,000 · 10,000 · 10,000 · 10,000 |
| Paid search, 40 opp. (program) | Performance lead | 72,000 | 24,000 · 24,000 · 12,000 · 12,000 |
| LinkedIn ads, 30 opp. (program) | Performance lead | 90,000 | 30,000 · 30,000 · 15,000 · 15,000 |
| Events and trade fairs, 30 opp. (program) | Event manager | 120,000 | 20,000 · 70,000 · 0 · 30,000 |
| Webinars and content, 28 opp. (program) | Content lead | 42,000 | 14,000 · 14,000 · 7,000 · 7,000 |
| Brand (program) | Head of marketing | 276,000 | 69,000 each quarter |
| Reserve (reserve) | CEO and head of marketing | 60,000 | 15,000 each quarter, released by decision |
| Total | 1,050,000 | 284,500 · 314,500 · 210,500 · 240,500 |
What the phasing shows:
- Demand programs front-loaded. EUR 226,000 of the EUR 324,000 in demand programs, about 70%, land in the first half, because most opportunities have to exist by the end of June.
- Brand flat. EUR 69,000 every quarter. Brand works through continuity.
- Events where the fairs are. A deposit in Q1, the spring fair in Q2, nothing in Q3, an autumn fair in Q4.
- Tools in Q1. Annual licenses are usually invoiced at the start of the contract year.
For paid media, split the quarter into months in the actuals tab. Google Ads can spend up to twice your average daily budget on a single day, but no more than 30.4 times it in a month. LinkedIn caps a campaign without an end date at seven times its daily budget in a week. Monthly limits per platform keep the quarter on plan.
Which formulas make the template work?
Five formulas carry the template: the annual total per line, subtotals per block, cost per opportunity, variance against plan and a flag for lines that need an explanation. They work the same way in Excel and Google Sheets. Everything else, like charts for the board, is built on top of them. The examples assume this layout on the plan tab: line in A, block in B, owner in C, the quarters in D to G, the total in H, planned opportunities in I, cost per opportunity in J, actual spend for the quarter in K and the variance in L.
- Annual total.
=SUM(D5:G5)across the four quarter columns. - Subtotal per block.
=SUMIFS(H:H,B:B,"program")adds every line whose block column says program. The syntax is the same in Excel and Google Sheets. - Cost per opportunity.
=IF(I5>0,H5/I5,"")stays empty for fixed lines without opportunities. - Variance in percent.
=(K5-D5)/D5for the first quarter: actual minus plan, divided by plan for the same quarter. - Explanation flag.
=IF(ABS(L5)>10%,"explain","")marks every line more than 10% off plan.
Add one conditional formatting rule on the cost per opportunity column: highlight a line when its actual cost per opportunity runs 30% above plan. That's the shift rule from the planning guide. A line that stays highlighted for two months in a row gets capped.
How do you run the quarterly review with the template?
Run the quarterly review in one hour with the review tab open. Compare plan and actual per line for spend, opportunities and cost per opportunity. Write one decision per line: keep, cap, shift or stop. Record who released money from the reserve and why. Then copy the new numbers into next quarter's plan.
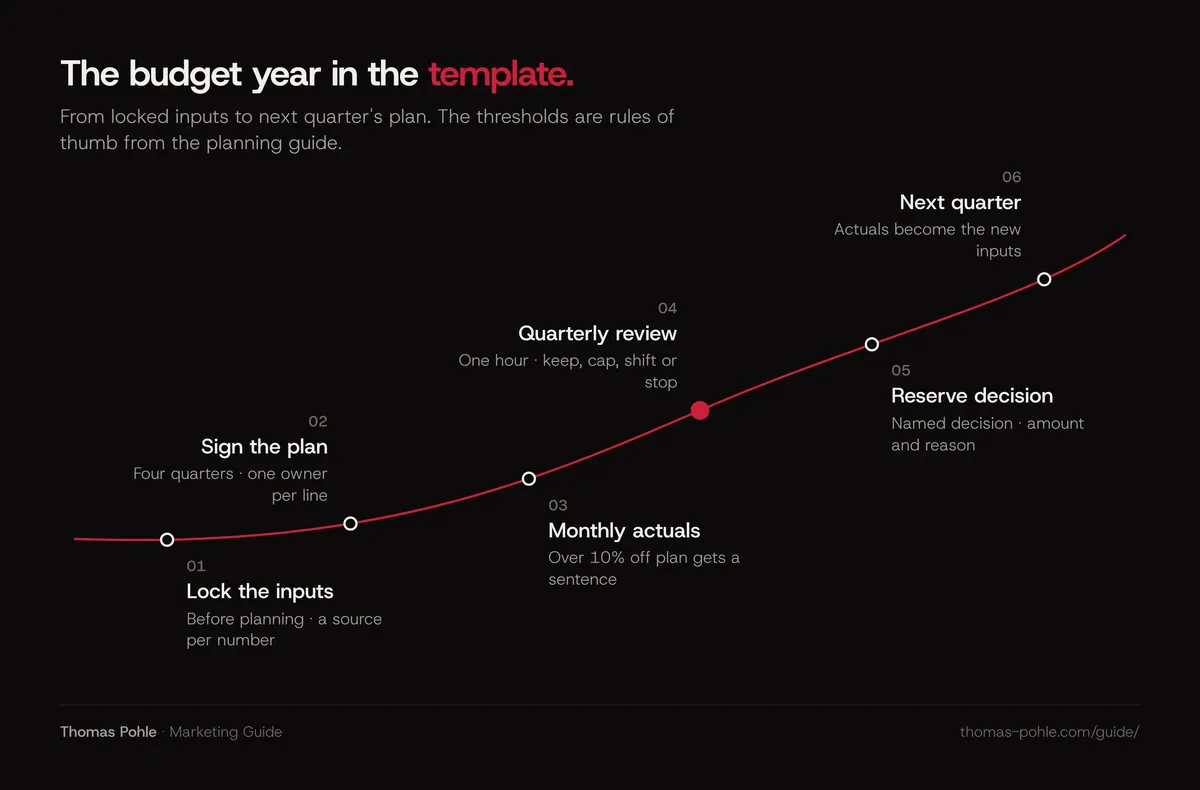
A checklist with thresholds for the review. The thresholds are the rules from the planning guide, and they're my rules of thumb, not benchmarks:
- Spend variance. Over 10% per line needs a written sentence.
- Cost per opportunity. 30% above plan for two months in a row: cap the line and move its money.
- New channel. First signals after one quarter. Continue only if its cost per opportunity is within plan, then give it a year before you judge it for good.
- Reserve. Released only by a named decision, logged with amount and reason.
- Brand. Stays at plan unless the whole budget is cut.
How to count opportunities per channel without heavy tracking is in the guide on measuring marketing success in B2B. How to decide where money moves is in the guide on splitting the marketing budget across channels.
Should you use Excel, Google Sheets or a planning tool?
For most B2B teams up to mid-market size a spreadsheet is enough. Excel and Google Sheets both handle the formulas, and finance already knows them. A planning tool pays off only when several teams edit budgets at once or when spend has to sync automatically with accounting. The structure matters more than the software.
My view: most companies don't need more software. They need better systems. A clean sheet with four tabs and a monthly routine beats a tool nobody updates.
My rule of thumb for switching: when more than three people edit the file every month, or when actuals take more than a day to collect, look at a planning tool. Until then, protect the input and formula cells, keep one master file and save a copy after every quarterly review.
What to do this week
You can build the first version of the template in an afternoon. Start from this year's actual spend, even if it's messy. The structure gets the numbers into shape faster than a perfect blank sheet does.
- Create the four tabs: inputs, plan, actuals, review.
- Fill the inputs and write the source next to each number.
- List every line of this year's spend and label it fixed, program or reserve.
- Add owner, quarters, planned opportunities and cost per opportunity per line.
- Enter the five formulas and the 30% highlight rule.
- Set a reserve line of about 10% of the program budget.
- Book the first quarterly review in the calendar, with the review tab as the agenda.
The first version will have gaps, usually in the opportunities per line. That's useful. The gaps show you which channels you fund without knowing what they deliver.
Want to build the first version with someone who has done it in-house? A one-day Momentum Workshop is one way to get there.
Frequently asked questions
Is there a free marketing budget template in Excel?
You can build this one in Excel or Google Sheets in an afternoon from the columns and formulas in this guide: four tabs, one row per line, quarters, planned opportunities, cost per opportunity and a review block. Most free downloads are built for consumer marketing and lack the link between spend and pipeline, so you'd have to rebuild them anyway.
Should salaries be in the marketing budget template?
Yes. People are usually the largest line and the main trade-off against agencies and media. Put them in the fixed base with an owner and a source, even if HR holds the official salary budget. Leave the planned opportunities empty for these lines. Without salaries, leadership never sees the full cost of marketing.
Should the template plan by month or by quarter?
Plan by quarter and track by month. Quarterly plans match how pipeline and sales cycles move, and they keep the file readable. Monthly tracking catches overspend early, especially on paid platforms that pace spend themselves. Google Ads, for example, may spend up to twice the average daily budget on one day.
What does a sample marketing budget for a small B2B company look like?
The same structure with fewer lines: one or two people, a handful of tools, the website, one or two channels and a reserve. The guide on how much marketing budget you need has a scenario with a CHF 550,000 budget, two marketers and CHF 250,000 in programs. Put those lines into the plan tab and phase them by quarter.
How is a digital marketing budget template different?
It isn't, in structure. Digital channels are lines in the program block: paid search, LinkedIn, other paid media, content and the website. What changes is the detail. Digital lines get one row per platform and monthly tracking, because platforms pace spend and report results by campaign.
Sources
- Gartner: 2025 CMO Spend Survey reveals marketing budgets have flatlined at 7.7% of overall company revenue (May 2025)
- Decision Marketing: Agencies firmly in the firing line as CMOs plot cutbacks (Gartner 2025 CMO Spend Survey shares for martech, labor and agencies, May 2025)
- Gartner: 2026 CMO Spend Survey finds CMOs allocate 15.3% of marketing budgets to AI (May 2026)
- Microsoft Support: SUMIFS function
- Google Docs Editors Help: SUMIFS function
- Microsoft Support: Use conditional formatting to highlight information in Excel
- Google Ads Help: About overdelivery and your average daily budget
- LinkedIn Marketing Solutions Help: Campaign and ad set budgets

Thomas PohleB2B marketing advisor in Zurich. More than ten years in B2B marketing at Link11, Beekeeper and smino, most recently as Head of Marketing. CEO and co-founder of TEISENDA. Researched and drafted with AI tools, checked against the sources listed above. More about Thomas