How do you create a positioning map?

Pick two buying criteria your customers actually use. Score every alternative they consider on both, with customer evidence instead of team opinion. Then plot the result. In B2B the useful axes come from win and loss reasons. My take: if you sit alone in the top right corner, your map is almost always wishful thinking.
This guide is for founders and marketing leads who need a map that survives a skeptical question. Haven't decided yet whom you serve and which alternatives you beat? Start with what positioning is and how a B2B company finds its own.
What is a positioning map?
A positioning map is a two-axis chart that shows where your offer and the alternatives a buyer considers sit on two criteria that matter to that buyer. In German it's called a Positionierungskreuz. Its job is to make a positioning decision visible. Which gap you take, whom you're close to, which trade-off you accept.
The map has three parts: two axes, each a buying criterion with a low and a high end; the alternatives, plotted as points; and a reading of clusters and gaps. Most of the value sits in the axes. Choose the wrong ones and every point is correct and useless.
Your alternatives go well beyond direct competitors. April Dunford defines positioning as how a product is different and better than alternatives for a particular set of customers. In B2B those often include a spreadsheet, an agency, an internal hire or doing nothing.
Is a positioning map the same as a perceptual map?
No. And the difference decides how much you can trust it. A perceptual map is built from buyer data: people rate brands, and the positions come from their answers. A positioning map is often drawn by the company itself, from internal opinion. Both look the same on a slide. So always state the source.
Classic perceptual mapping uses statistics such as factor analysis or multidimensional scaling on survey data. Researchers Adaval, Coupey and Narayanan point out that these methods don't let consumers name the dimensions or place the brands, and propose letting buyers draw the map directly. With a few dozen customers, a full survey is rarely realistic for a B2B company. The practical middle ground is axes and scores from interviews and deal records.
| Version | Axes chosen by | Positions based on | Trust it for |
|---|---|---|---|
| Workshop map | The team | Team opinion | Starting a discussion |
| Evidence map | Win and loss reasons | Customer ratings and deal notes | Positioning decisions |
| Perceptual map | Statistics or buyers | Survey of many buyers | Markets with enough respondents |
Label your map with its version. A workshop map sold as market truth misleads your leadership team.
Why do most positioning maps show wishful thinking?
My take: most positioning maps show wishful thinking. The team picks axes it already wins on and then scores itself. The company lands alone in the top right corner, far from everyone else. Buyers rarely see that much distance. Research from the Ehrenberg-Bass Institute suggests most buyers see little difference between the brands they buy.
A summary on the Ehrenberg-Bass Institute's website describes the work of Romaniuk, Sharp and Ehrenberg on perceived differentiation this way: most consumers don't perceive the brands they buy as significantly different from the competition, and those brands sell anyway. Its example is a survey of computer users in the United Kingdom, in which 77 % of Apple users didn't perceive the brand as unique. That's consumer data. For B2B, read it as a warning. It isn't a measurement.
Five patterns give away a wishful map:
- Vanity axes. Quality, innovation, customer focus. Every vendor claims the high end.
- Mirrored axes. Two axes that say the same thing, so every point lands on a diagonal.
- Missing alternatives. Only the competitors the team watches, without the spreadsheet, the agency or the decision to wait.
- Self-scoring. The company rates itself and rates competitors from their websites.
- Designed white space. An empty quadrant nobody checked for demand.
None of this takes bad intent. A workshop map collects what the room believes. Fix it by changing who supplies the axes and the scores.
Which axes actually work in B2B?
A B2B axis works when real buyers use it to choose between alternatives, when it spreads those alternatives apart and when a buyer can verify it. Good candidates describe how an offer is delivered or whom it fits: degree of specialization, who does the work, time to first value, depth of integration or contract model.
| Axis | Low end | High end | Useful when |
|---|---|---|---|
| Specialization | Built for every industry | Built for one segment | Buyers ask if you know their industry |
| Who does the work | Customer does it | Vendor does it | Buyers compare tools, services and hires |
| Time to first value | Months of setup | Working in days | Lost deals mention implementation |
| Fit with existing systems | Stands alone | Deeply integrated | The buyer's stack decides the shortlist |
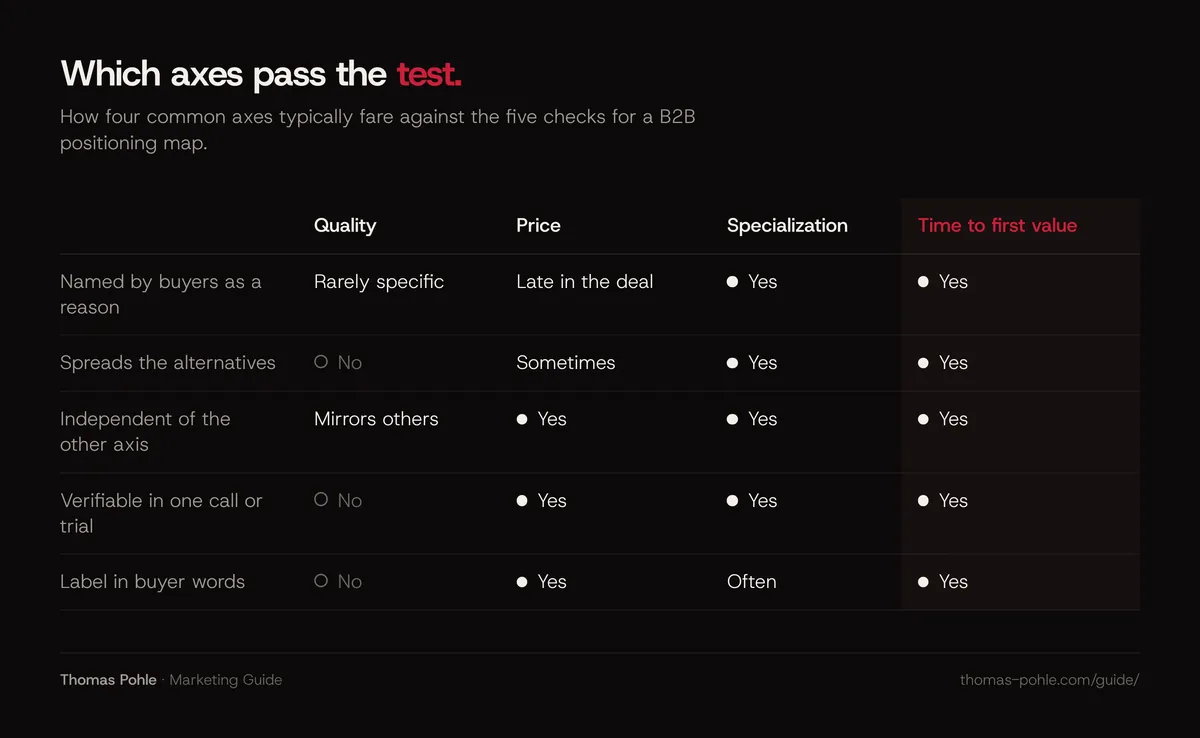
Price works only when buyers name it as a reason and the alternatives really differ on it. Quality almost never works. Nobody plots themselves at the low end. Every axis has to pass a test before it goes on the map. The thresholds below are my rules of thumb for a company with 10 to 50 customers. They aren't research benchmarks:
- Named by buyers. At least 3 of 10 interviewed customers mention the criterion without prompting, or it appears in at least 3 of your last 10 win or loss reasons.
- Spreads the field. On a 1 to 5 scale, the alternatives are at least 2 points apart. Everyone between 3 and 4? Then the axis separates nothing.
- Independent of the other axis. When you sort the alternatives by one axis, the order on the other axis changes. If it doesn't, drop one.
- Verifiable. A buyer could check the score in one call, one trial or one reference conversation.
- In buyer words. The label is a phrase a customer used. Internal terms are out.
How do you create a positioning map step by step?
You create a positioning map in six steps: collect buying criteria from customers and deal records, list every alternative a buyer considers, choose two axes that pass the test, score each alternative with customer evidence, plot and label the map, and then check the open spaces against real demand. My estimate: a first evidence map takes about two weeks, mostly for the interviews.
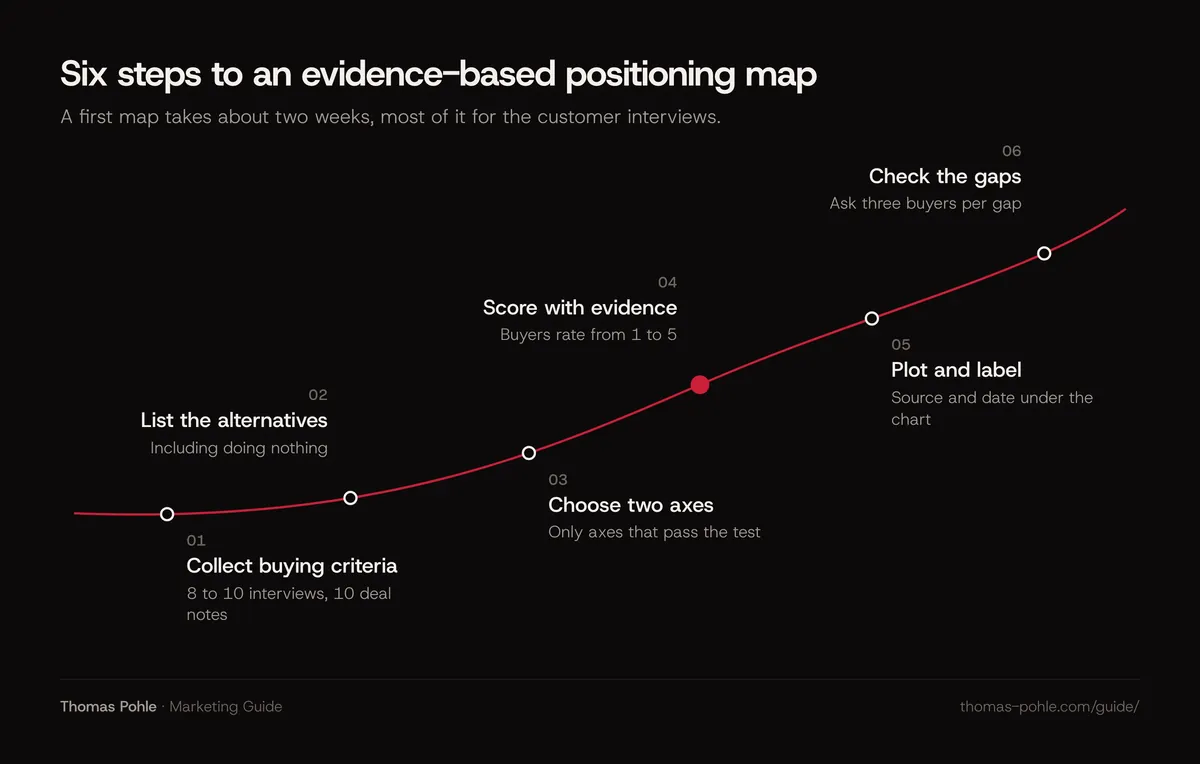
- Collect buying criteria. Interview 8 to 10 recent customers and read the notes of your last 10 won and lost deals. Ask what they compared and what almost made them choose something else. Jenni Romaniuk's report on category entry points for the LinkedIn B2B Institute offers useful prompts: when, where, why and with whom the need came up.
- List the alternatives. Everything those buyers considered, including doing nothing and hiring someone.
- Choose two axes. Count how often each criterion came up and run the axis test above. Pick the two that pass and matter most.
- Score with evidence. Ask customers to rate each alternative they know on both axes from 1 to 5. Score yourself the same way. Never from your own pitch.
- Plot and label. Write the axis ends in buyer words, add source and date under the chart.
- Check the gaps. For every empty area, ask three buyers whether they would pay for that combination. An empty quadrant without demand isn't a position.
Keep your team's own estimates. Plot them next to the customer scores. As the example shows, that's where you learn the most.
What does a worked example look like?
Here's a hypothetical example to make the steps concrete. The company and all numbers are invented for illustration. A Swiss software firm with 40 employees sells time tracking to construction companies. It interviews 8 customers and reviews 5 lost deals, 13 conversations in total, and counts which criteria buyers named without being asked.
Time to go live came up in 7 of 13 conversations, use on the construction site without a stable connection in 6, price in 4, accounting integration in 3. The map uses the top two. The alternatives buyers named: paper and spreadsheets, the time module of a large ERP system, a generic time tracking app.
| Alternative | Go-live speed (1 to 5) | Site use (1 to 5) | Rated by |
|---|---|---|---|
| Paper and spreadsheets | 4.6 | 1.8 | 11 buyers |
| ERP time module | 1.4 | 3.1 | 6 buyers |
| Generic time tracking app | 4.1 | 2.2 | 7 buyers |
| The firm, rated by buyers | 3.2 | 4.4 | 13 buyers |
| The firm, team's own estimate | 4.5 | 4.6 | Leadership team |
Both axes pass the test: the scores spread from 1.4 to 4.6 and from 1.8 to 4.4, and the order changes between them. The finding sits in the last two rows. The team believed it was as fast to start as a spreadsheet. Buyers rate it 1.3 points slower. Its real strength is site use. Nobody else comes close there.
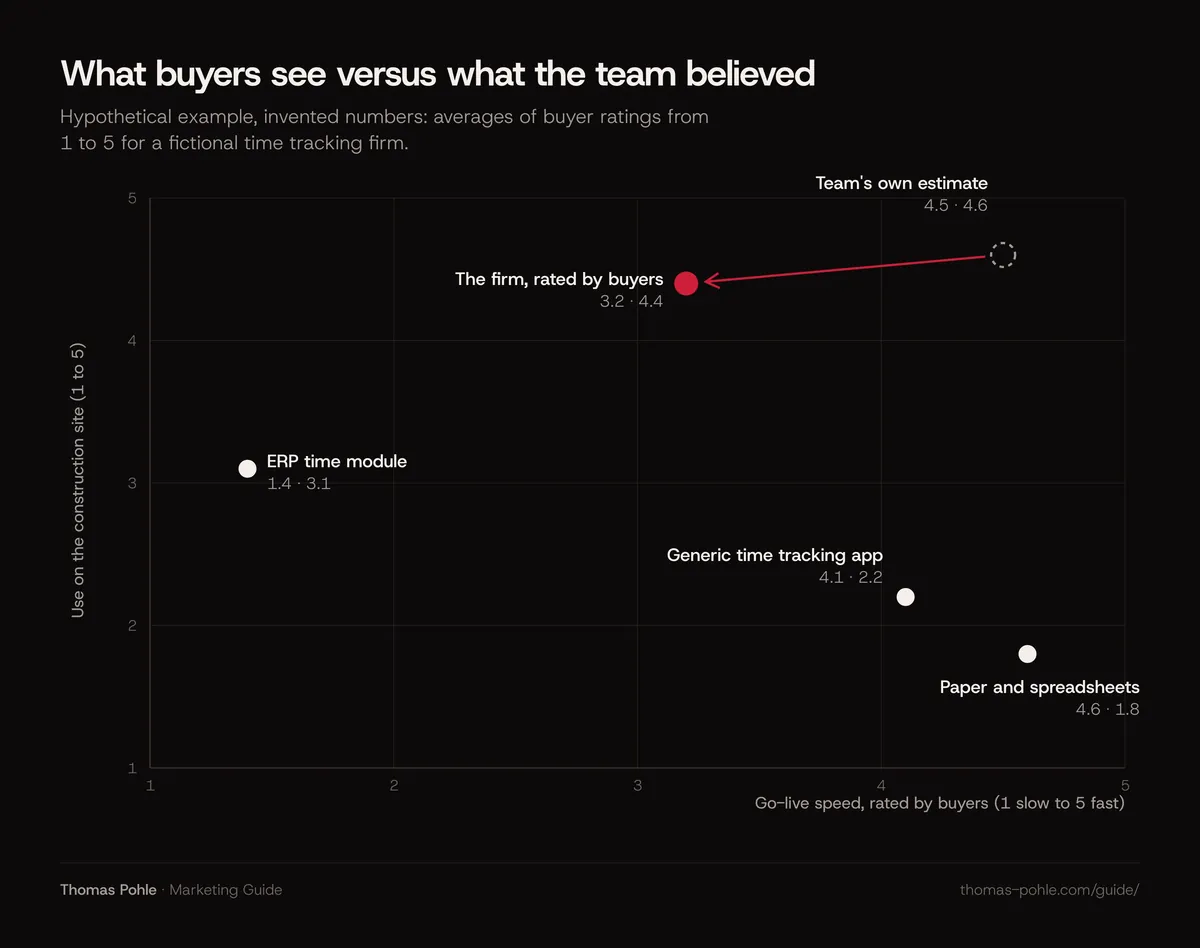
So lead with site use, which buyers already credit. Fix onboarding before it goes into the pitch. A workshop map would have pushed the firm into a speed message its own customers don't believe.
How do you read the map without fooling yourself?
Treat a positioning map as a question generator. Never as proof. A cluster shows where buyers see interchangeable options. A gap shows where to ask whether demand exists. Your own position shows which claim buyers already believe. When a key alternative sits on top of you, two axes aren't enough.
That last case is common. I hit it myself. When I separate my own advisory from the alternatives, the obvious axes are how well someone understands the business and whether they do the work. Here's my view of the field. An agency executes and often lacks the business view. A classic consultant brings the view and delivers slides. A freelancer covers one channel. A senior operator who executes with the client's team sits in the corner where both are high. So does a full-time head of marketing. What separates the two is time and cost. A hire is slow to find and expensive to keep. Two axes can't show that.
More than two criteria decide? Switch tools. In Kim and Mauborgne's strategy canvas from Blue Ocean Strategy, the horizontal axis lists the factors an industry competes on and the vertical axis shows the offering level buyers receive on each. A canvas with five or six buyer criteria often tells a B2B story better than a forced two-axis chart.
Two more reading rules. A one-point gap on a 1 to 5 scale from 10 buyers is a hint. It isn't a finding yet. And draw one map per segment. Construction and logistics firms may use completely different criteria, and mixing them averages away the insight.
The map feeds the next decisions: what the brand should stand for, covered in how to define brand positioning, and where marketing puts its effort, covered in how to build a B2B marketing strategy.
What to do this week
Start your first evidence map this week. You need the deal records you already have and five customer calls. The goal is one chart with a stated source that your leadership team can argue with.
- Pull the notes of your last 10 won and lost deals and write down every reason in one sentence each.
- Call five customers and ask what they compared before they chose you, and what they would use without you.
- List every alternative they named, including doing nothing and hiring someone.
- Count the criteria and run the axis test: named by at least 3, spread of at least 2 points, independent, verifiable.
- Ask the same customers to rate the alternatives they know from 1 to 5 on your two axes.
- Plot your team's estimate next to the buyer rating and discuss every gap larger than one point.
- Write the source and the date under the chart before it goes into any deck.
If the map shows that your positioning itself is unclear, a one-day Momentum Workshop settles positioning, ideal customer and the first channel with your team.
A good positioning map is rarely flattering. If it makes the room uncomfortable, buyers would probably recognize it.
Frequently asked questions
What is the difference between a positioning map and a positioning statement?
A positioning map shows where you and the alternatives sit on two buying criteria, based on evidence. A positioning statement writes down the decision you take from it: target customer, need, category, main benefit and the main alternative you beat. The map informs the statement. Draw the map first.
How many customers do I need for a reliable positioning map?
There's no published minimum for B2B. My rule of thumb: get ratings from at least 8 to 10 buyers per alternative before you read small differences. With fewer, the map still helps you choose axes and spot surprises. Treat anything under one point on a 1 to 5 scale as noise.
Should price be one of the axes on a positioning map?
Only when buyers name price as a reason for their choice and the alternatives really differ on it. My take: in many B2B purchases price filters at the end. It rarely shapes the shortlist. If price shows up in fewer than three of ten win or loss reasons, pick a criterion that explains the choice better.
Can I build a positioning map with AI tools?
AI assistants can help you sort interview notes, count criteria and draft axis labels. They can't supply the scores. They don't know what your buyers think. Ask one to place competitors on a map and you get a summary of their websites. That's exactly the self-description your map should test.
Sources
- April Dunford: Positioning (homepage definition)
- Adaval, Coupey and Narayanan: Direct Mapping of Consumer Perceptions, Developments in Marketing Science (Springer, 2015)
- Ehrenberg-Bass Institute: Differentiation vs. distinctiveness (summary of Romaniuk, Sharp and Ehrenberg on perceived brand differentiation)
- Blue Ocean Strategy: Strategy Canvas (W. Chan Kim and Renée Mauborgne)
- Jenni Romaniuk: Category Entry Points in a B2B World, LinkedIn B2B Institute (2022)

Thomas PohleB2B marketing advisor in Zurich. More than ten years in B2B marketing at Link11, Beekeeper and smino, most recently as Head of Marketing. CEO and co-founder of TEISENDA. Researched and drafted with AI tools, checked against the sources listed above. More about Thomas